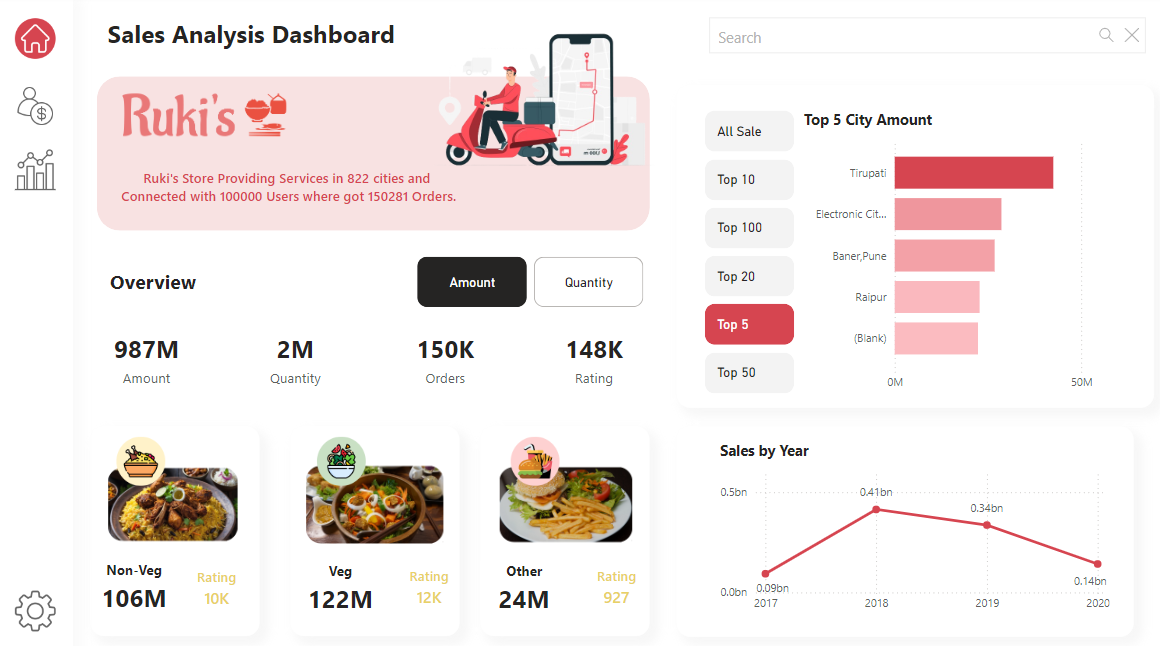
Excited to present my latest project - Food Delivery Sales Analysis Dashboard! 🍕🍛
This dashboard was created to analyze the performance of a food delivery system. It provides actionable insights based on various metrics, and its design is modern and engaging, going beyond traditional dashboards. Here's a detailed breakdown of the features:
- 📊 Year-wise Sales Analysis to track performance trends over time.
- 🌆 Top 10 Cities where sales are the highest, offering insights into key markets.
- 🍴 Breakdown of Veg and Non-Veg items, allowing users to explore data based on customer preferences and ratings.
- ⭐ Essential KPIs such as total orders, ratings, and total sales for quick analysis.
During the development of this dashboard, I focused on creating an intuitive user experience with interactive elements and advanced filtering techniques.
Key Features:
- 💠 Interactive Filters to explore data based on categories, regions, and more.
- 💠 Last Data Refresh Display to ensure the latest insights are always available.
- 💠 Automated Data Refresh for real-time updates using Power BI Service.
The dashboard's modern design stands out, offering a visually attractive experience, as shown in the image below.
You can access all project files, including resources and images used in the dashboard, through the GitHub repository: